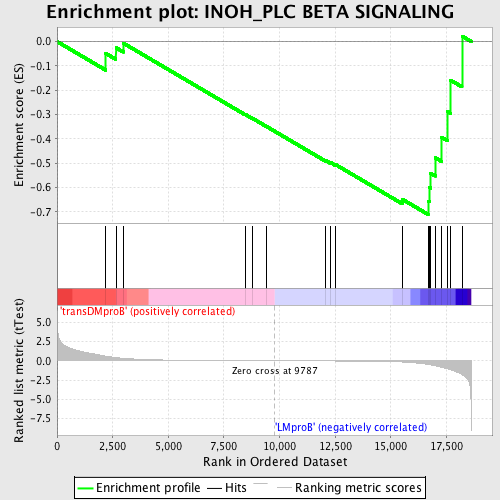
Profile of the Running ES Score & Positions of GeneSet Members on the Rank Ordered List
| Dataset | Set_04_transDMproB_versus_LMproB.phenotype_transDMproB_versus_LMproB.cls #transDMproB_versus_LMproB |
| Phenotype | phenotype_transDMproB_versus_LMproB.cls#transDMproB_versus_LMproB |
| Upregulated in class | LMproB |
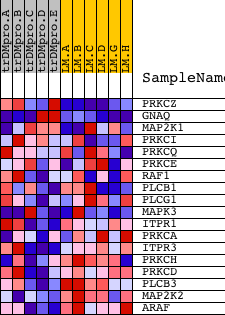
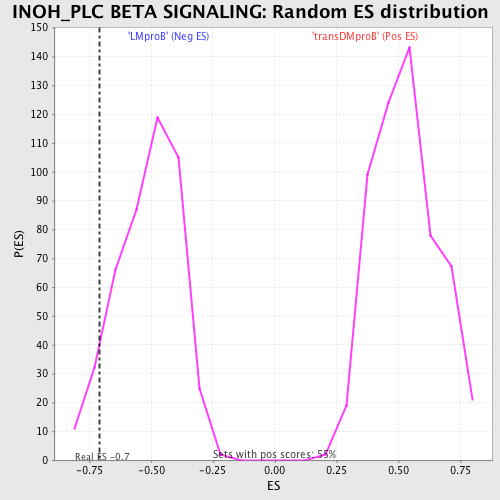
| GeneSet | INOH_PLC BETA SIGNALING |
| Enrichment Score (ES) | -0.7107427 |
| Normalized Enrichment Score (NES) | -1.3875198 |
| Nominal p-value | 0.07158837 |
| FDR q-value | 1.0 |
| FWER p-Value | 1.0 |
| PROBE | DESCRIPTION (from dataset) | GENE SYMBOL | GENE_TITLE | RANK IN GENE LIST | RANK METRIC SCORE | RUNNING ES | CORE ENRICHMENT | |
|---|---|---|---|---|---|---|---|---|
| 1 | PRKCZ | 5260 | 2187 | 0.593 | -0.0487 | No | ||
| 2 | GNAQ | 4786 23909 3685 | 2646 | 0.415 | -0.0252 | No | ||
| 3 | MAP2K1 | 19082 | 2979 | 0.314 | -0.0066 | No | ||
| 4 | PRKCI | 9576 | 8460 | 0.014 | -0.2996 | No | ||
| 5 | PRKCQ | 2873 2831 | 8796 | 0.011 | -0.3164 | No | ||
| 6 | PRKCE | 9575 | 9432 | 0.004 | -0.3501 | No | ||
| 7 | RAF1 | 17035 | 12066 | -0.026 | -0.4886 | No | ||
| 8 | PLCB1 | 14832 2821 | 12286 | -0.029 | -0.4970 | No | ||
| 9 | PLCG1 | 14753 | 12496 | -0.032 | -0.5046 | No | ||
| 10 | MAPK3 | 6458 11170 | 15520 | -0.160 | -0.6485 | No | ||
| 11 | ITPR1 | 17341 | 16679 | -0.474 | -0.6557 | Yes | ||
| 12 | PRKCA | 20174 | 16737 | -0.507 | -0.6000 | Yes | ||
| 13 | ITPR3 | 9195 | 16788 | -0.528 | -0.5414 | Yes | ||
| 14 | PRKCH | 21246 | 17001 | -0.647 | -0.4776 | Yes | ||
| 15 | PRKCD | 21897 | 17286 | -0.851 | -0.3941 | Yes | ||
| 16 | PLCB3 | 23799 | 17555 | -1.037 | -0.2882 | Yes | ||
| 17 | MAP2K2 | 19933 | 17691 | -1.176 | -0.1590 | Yes | ||
| 18 | ARAF | 24367 | 18200 | -1.798 | 0.0224 | Yes |